Loading...
data analytics course in pune

Best Data Analytics Pay After Placement Course

In the era of big data, organizations across industries are grappling with the challenge of making sense of the massive amounts of data at their disposal. Data Analytics Pay After Placement Classes have emerged as a game-changer, equipping professionals with the skills to extract valuable insights and drive data-driven decision-making. As one of the leading training institutes in Pune, Guidance Point recognizes the critical importance of Data Analytics and offers comprehensive courses tailored to meet the evolving needs of the industry. Data Analytics Pay After Placement Course provide a robust foundation in the principles and practices of data analysis, enabling students to unlock the power of data. These courses cover a wide spectrum of topics, ranging from data mining and statistical analysis to predictive modeling and data visualization.

By combining theoretical knowledge with hands-on practical training, Data Analytics Course in Pune empower students to navigate the complexities of data effectively. One of the key strengths of Data Analytics Pay After Placement training lies in their industry-relevant curriculum. The Data Analytics course in Pune’s content is meticulously designed to align with the latest trends and best practices in the field, ensuring that students acquire cutting-edge skills. Experienced industry professionals and subject matter experts contribute to the development of the curriculum, ensuring that it remains relevant and applicable to real-world scenarios.


Scope of Data Analytics Pay After Placement Classes

In today's data-driven world, the demand for professionals skilled in Data Analytics is skyrocketing. Data Analytics Pay After Placement classes have become crucial for businesses and organizations seeking to leverage the power of data to make informed decisions, optimize operations, and gain a competitive edge. This comprehensive course aims to equip students with the knowledge and practical skills necessary to thrive in the field of Data Analytics. Data Analytics Pay After Placement Classes provide a holistic education that encompasses a wide range of topics, including data mining, statistical analysis, predictive modeling, data visualization, and business intelligence. These courses are designed to prepare students for roles such as Data Analysts, Business Intelligence Analysts, Data Scientists, and Data Mining Specialists, among others. The scope of Data Analytics Course in Pune extends beyond the classroom, offering students the opportunity to work on real-world projects and case studies.

This practical experience allows them to apply their knowledge and skills in a simulated environment, enhancing their problem-solving abilities and preparing them for the challenges they may face in their future careers. Furthermore, Data Analytics Pay After Placement training emphasize the importance of staying up-to-date with the latest technologies and methodologies in the field. The curriculum is regularly updated to reflect the evolving industry trends, ensuring that students are equipped with the most relevant and cutting-edge knowledge. By completing Data Analytics Pay After Placement Course, students gain a competitive edge in the job market, as they become proficient in the tools and techniques that are in high demand across various industries. With the ability to extract valuable insights from complex data sets, these professionals can contribute to data-driven decision-making processes, driving business growth and innovation.


Learning pathway of Data Analytics Pay After Placement classes
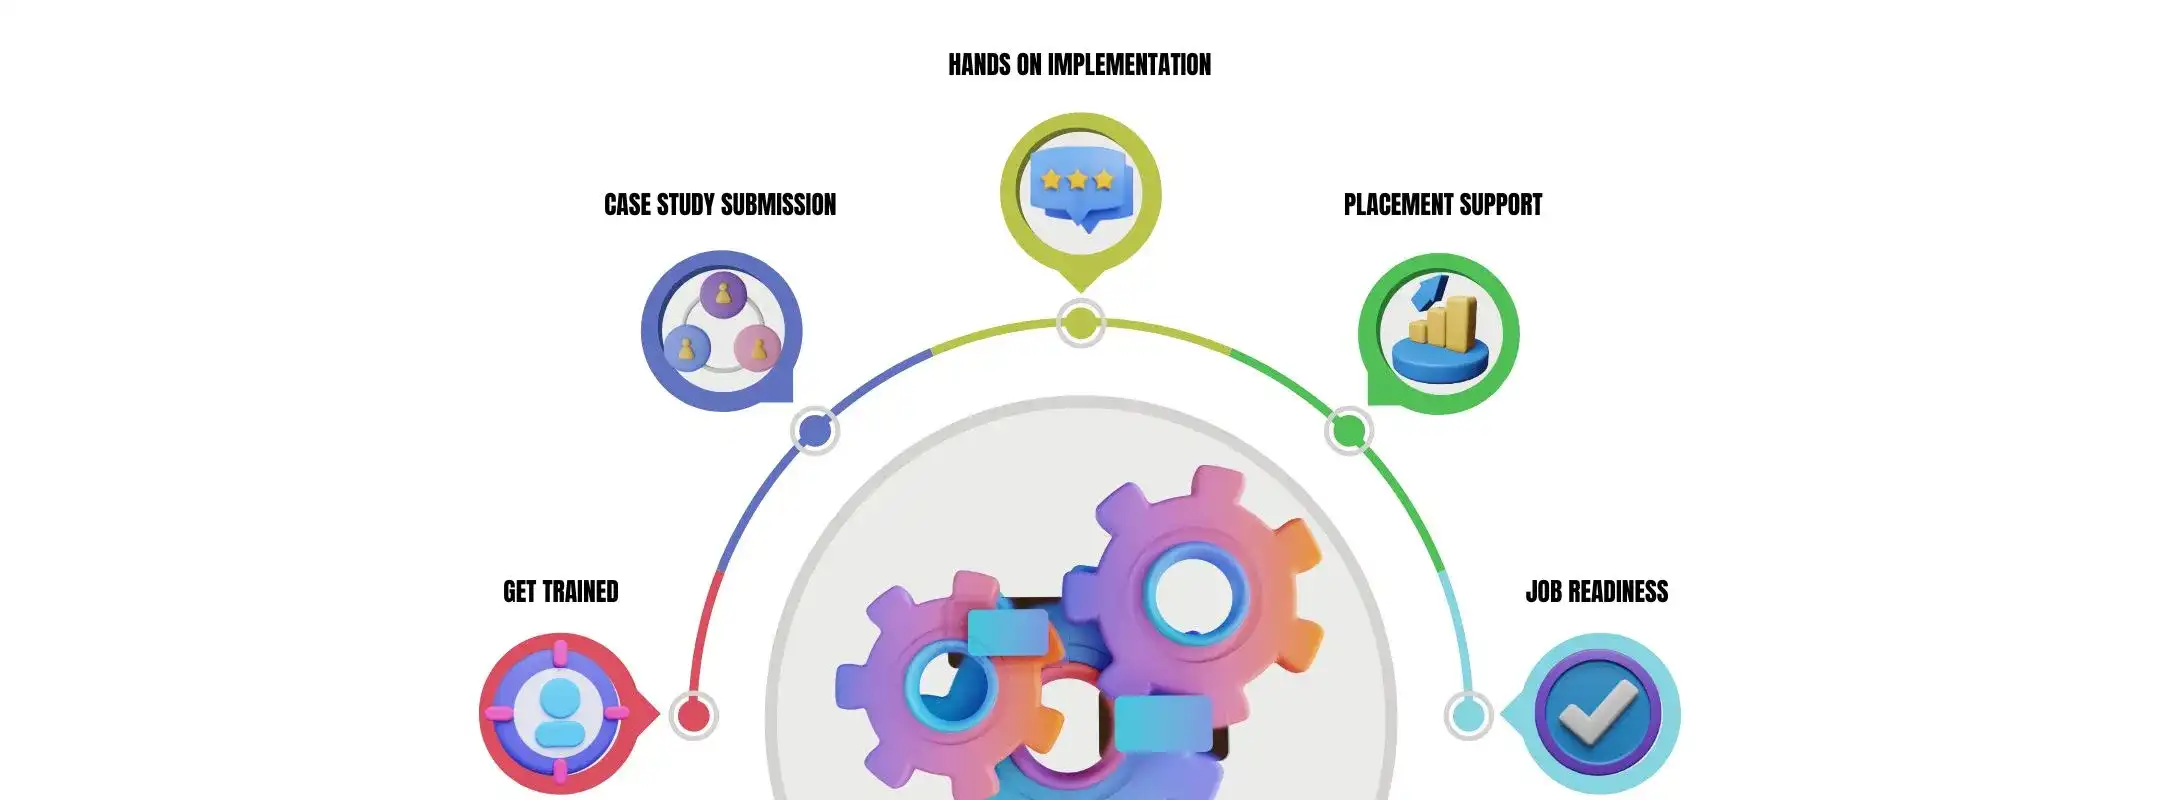

data analytics course in pune


Challenges in Data Analytics Pay After Placement Classes


  • While Data Analytics Courses in Pune promise incredible opportunities, they also present several challenges. One of the primary challenges is the sheer volume and complexity of data that organizations deal with today. In Data Analytics Pay After Placement Course, students must learn to handle structured and unstructured data from various sources, ensuring data quality and integrity. Cleaning, transforming, and preparing data for analysis can be a time-consuming and intricate process, requiring a deep understanding of data management techniques.

  • Another challenge in Data Analytics Pay After Placement Classes is keeping up with the ever-evolving technologies and methodologies in the field. The landscape of data analytics is constantly changing, with new tools, algorithms, and frameworks emerging regularly. Data Analytics Pay After Placement Classes must continuously update their curriculum to ensure that students are equipped with the latest knowledge and skills, enabling them to stay relevant and competitive in the job market.

  • Data privacy and security are also critical concerns in Data Analytics Pay After Placement Course. As organizations become increasingly data-driven, the need for robust data governance and compliance measures has become paramount. Students in Data Analytics Courses in Pune must learn to navigate the complex regulatory landscape, understand data privacy laws, and implement best practices to protect sensitive information while leveraging data for business insights.

  • Additionally, Data Analytics Pay After Placement Course must address the challenge of bridging the gap between theory and practical application. While theoretical foundations are essential, students must also develop hands-on experience working with real-world data sets and scenarios. Incorporating industry-relevant projects and case studies into the curriculum is crucial to ensuring that students are prepared to tackle real-world challenges upon entering the workforce.

  • Furthermore, Data Analytics Pay After Placement Course must equip students with the ability to communicate complex data findings effectively. Data analysts and scientists must not only possess strong analytical skills but also the capability to convey their insights in a clear and compelling manner to diverse stakeholders, including executives, decision-makers, and cross-functional teams.

  • To address these challenges, Data Analytics Pay After Placement Course aim to provide a comprehensive curriculum that combines theoretical knowledge with practical application. Regular updates to the course content, industry collaborations, and a focus on developing both technical and soft skills are essential to ensuring that students are well-prepared to navigate the complexities of the data analytics field successfully.


Tools Used in data Analytics Course in Pune

Blog-post Thumbnail
Blog-post Thumbnail
Blog-post Thumbnail
Blog-post Thumbnail
Blog-post Thumbnail
Blog-post Thumbnail
Blog-post Thumbnail
Blog-post Thumbnail


Importance of Power BI in data analytics


Power BI is a powerful business intelligence and data visualization tool developed by Microsoft. Learning Power BI can be extremely valuable for anyone pursuing a career in data analytics or working with data in general. Power BI is renowned for its exceptional data visualization capabilities. It allows you to create stunning and interactive reports, dashboards, and visualizations that can convey complex data insights in a clear and compelling manner. Effective data visualization is crucial in data analytics as it helps communicate findings to stakeholders and decision-makers.

Power BI provides robust data transformation and modeling tools through its Power Query Editor and Data Model. These features enable you to clean, transform, and shape raw data from various sources into a structured format suitable for analysis. Data preparation is a critical step in the data analytics process, and Power BI streamlines this process. Start the courses at guidance point without worring about course fee may it be online data science or power BI. No problem in pay after placements policy no need to worry about income share agreement or never worry about capstone project our team will assist you.

Power BI can connect to a wide range of data sources, including databases, Excel files, cloud-based services, and more. This integration capability allows you to consolidate data from multiple sources, enabling comprehensive analysis and reporting. While Power BI's strength lies in data visualization, it also offers advanced analytics capabilities through integration with other Microsoft tools like Azure Machine Learning and SQL Server Analysis Services.

This integration enables you to perform predictive analytics, forecasting, and other advanced analytical techniques. Power BI provides a collaborative environment where reports and dashboards can be shared with team members or published to the Power BI Service for broader distribution. This feature facilitates data-driven decision-making by ensuring that insights are accessible to relevant stakeholders.

As organizations increasingly rely on data-driven insights, the demand for professionals proficient in data visualization and business intelligence tools like Power BI continues to grow. Having Power BI skills can make you a more valuable asset in the job market. Power BI integrates seamlessly with other Microsoft products, such as Excel, SQL Server, and Azure.

If your organization uses Microsoft tools, learning Power BI can be an advantage as it aligns with the existing technology stack. In summary, a Power BI course is crucial for data analytics professionals as it equips them with the skills to gather, transform, visualize, and share data insights effectively. It empowers data analysts to communicate complex information clearly, enabling data-driven decision-making and driving business value.


Benefits in Data Analytics Pay After Placement Course


  • Enrolling in Data Analytics Pay After Placement Course offers numerous benefits to students, equipping them with the skills and knowledge necessary to succeed in the rapidly evolving field of data analytics. These courses provide a comprehensive understanding of data analysis techniques, enabling students to uncover valuable insights that can drive business growth and innovation mainly for final year students.

  • One of the primary benefits of Data Analytics Pay After Placement classes is the ability to develop a deep understanding of data mining, statistical analysis, predictive modeling, and data visualization techniques. Through hands-on training and practical exercises, students gain proficiency in leveraging these tools and methodologies to extract meaningful patterns and trends from complex data sets.

  • Data Analytics Pay After Placement training also equip students with the ability to communicate complex data findings effectively. Effective communication is a critical skill in the field of data analytics, as professionals are often required to present their findings to stakeholders and decision-makers. By honing their communication skills, students become valuable assets to any organization, capable of translating data-driven insights into actionable strategies.

  • Furthermore, Data Analytics Pay After Placement classes often include industry-relevant projects and case studies, providing students with practical experience and enhancing their employability. These real-world scenarios allow students to apply their knowledge in simulated environments, preparing them for the challenges they may face in their future careers.

  • Another significant benefit of Data Analytics Pay After Placement training is the placement support offered by the institute. Many institutes have established partnerships with leading companies, enabling them to connect their students with potential employers. This support system increases the chances of securing lucrative job opportunities in the field of data analytics, providing a seamless transition from academia to the professional world.

    Additionally, Data Analytics Pay After Placement Classes offer a pathway to various specialized roles within the data analytics domain. Upon successful completion of the course, students can explore career opportunities such as Data Analyst, Business Intelligence Analyst, Data Scientist, Predictive Modeler, Data Visualization Expert, and more. These diverse roles cater to different interests and strengths, allowing students to pursue their passion and contribute to data-driven decision-making processes across various industries.

  • By enrolling in Data Analytics Pay After Placement classes, students gain a competitive edge in the job market, as they become proficient in the tools and techniques that are in high demand across various sectors. The combination of theoretical knowledge, practical skills, and industry exposure provided by these courses equips students with the necessary expertise to thrive in the data-driven world.

Contact Us


Careers from Data Analytics Pay After Placement training


1. Data Analyst Data Analysts are responsible for collecting, processing, and analyzing data from various sources to identify patterns, trends, and insights that can inform business decisions. They work closely with stakeholders to understand their data requirements and translate complex data into actionable information. Completing a comprehensive Data Analytics Pay After Placement training equips individuals with the skills necessary to excel as a Data Analyst across industries like finance, healthcare, marketing, and logistics.

2. Business Intelligence Analyst Business Intelligence Analysts leverage data analytics tools and techniques to support strategic decision-making within organizations. They develop and implement business intelligence solutions, such as dashboards, reports, and data visualizations, to help businesses gain a competitive edge through data-driven insights. A Data Analytics Pay After Placement training provides the necessary training to become a proficient Business Intelligence Analyst, bridging the gap between data and business objectives.

3. Data Scientist For those with a passion for cutting-edge technologies and advanced analytical techniques, a career as a Data Scientist may be the perfect fit. Data Scientists combine their expertise in statistics, machine learning, and programming to extract valuable insights from complex data sets. They develop and implement predictive models, algorithms, and machine learning applications to solve real-world problems and drive innovation across various industries. A Data Analytics Pay After Placement training equips individuals with the foundational knowledge and skills required to pursue this challenging and rewarding career path.

4. Data Mining Specialist Data Mining Specialists are in-demand professionals who specialize in identifying patterns and relationships within large data sets using advanced data mining techniques. They collaborate with cross-functional teams to uncover hidden insights and opportunities, enabling businesses to make data-driven decisions and gain a competitive advantage. A Data Analytics Pay After Placement training provides comprehensive training in data mining techniques, preparing individuals for this specialized role.

5. Data Visualization Expert The field of data analytics also offers exciting opportunities for those with a flair for visual communication. Data Visualization Experts are responsible for transforming complex data into clear and compelling visual representations, such as charts, graphs, and interactive dashboards. These professionals play a crucial role in communicating data-driven insights to stakeholders, enabling them to comprehend and act upon the information effectively. A Data Analytics Pay After Placement training emphasizes the importance of data visualization, equipping individuals with the skills to excel in this role.

6. Other Career Paths Beyond these core roles, individuals skilled in data analytics can explore a variety of other career paths, including Predictive Modelers, Big Data Engineers, Analytics Consultants, Marketing Analytics Specialists, and Risk Analytics Analysts. Each of these roles offers unique challenges and opportunities, catering to diverse interests and strengths. A Data Analytics Pay After Placement training provides a solid foundation for pursuing these specialized career paths within the field of data analytics.

The demand for data analytics professionals is not limited to any specific industry. Organizations across sectors, including finance, healthcare, retail, manufacturing, and technology, are actively seeking talented individuals with advanced data analytics skills. This diversification of career opportunities ensures that graduates of Data Analytics Courses in Pune can find fulfilling roles that align with their passions and career goals. As the world becomes increasingly data-driven, the career prospects for those skilled in data analytics are promising. With the ability to uncover valuable insights from complex data sets, these professionals play a crucial role in driving business growth, innovation, and strategic decision-making processes across various industries.


Data Analytics Pay After Placement Classes Training Syllabus

Introduction

  • MS Office Versions (similarities and differences)
  • Interface (latest available version)
  • Row and Columns
  • Keyboard shortcuts for easy navigation
  • Data Entry (Fill series)
  • Find and Select
  • Clear Options
  • Ctrl+Enter
  • Formatting options (Font, Alignment, Clipboard (copy, paste special))

Referencing, Named ranges, Uses, Arithmetic Functions

  • Mathematical calculations with Cell referencing (Absolute, Relative, Mixed)
  • Functions with Name Range
  • Arithmetic functions (SUM, SUMIF, SUMIFS, COUNT, COUNTA, COUNTIFS, AVERAGE, AVERAGEIFS, MAX, MAXIFS, MIN, MINIFS)

Logical functions

  • Logical functions: IF, AND, OR, NESTED IFS, NOT, IFERROR
  • Usage of Mathematical and Logical functions nested together

Referring data from different tables: Various types of Lookup, Nested IF

  • LOOKUP
  • VLOOKUP
  • NESTED VLOOKUP
  • HLOOKUP
  • INDEX
  • INDEX WITH MATCH FUNCTION
  • INDIRECT
  • OFFSET

Advanced functions

  • Combination of Arithmetic, Logical, Lookup functions
  • Data Validation (with Dependent drop down)

Date and Text Functions

  • Date Functions: DATE, DAY, MONTH, YEAR, YEARFRAC, DATEDIFF, EOMONTH
  • Text Functions: TEXT, UPPER, LOWER, PROPER, LEFT, RIGHT, SEARCH, FIND, MID, TTC, Flash Fill
  • Data Handling: Data cleaning, Data type identification, Remove Duplicates, Formatting and Filtering
  • Number Formatting (with shortcuts)
  • CTRL+T (Converting into an Excel Table)
  • Formatting Table
  • Remove Duplicate
  • SORT
  • Advanced Sort
  • FILTER
  • Advanced Filter

Data Visualization: Conditional Formatting, Charts

  • Conditional formatting (icon sets/Highlighted colour sets/Data bars/custom formatting)
  • Charts: Bar, Column, Lines, Scatter, Combo, Gantt, Waterfall, pie
  • Data Summarization: Pivot Report and Charts
  • Pivot Reports: Insert, Interface, Crosstable Reports; Filter, Pivot Charts, Slicers
  • Slicers: Add, Connect to multiple reports and charts
  • Calculated field, Calculated item

Data Summarization: Dashboard Creation, Tips and Tricks

  • Dashboard: Types, Getting reports and charts together, Use of Slicers
  • Design and placement: Formatting of Tables, Charts, Sheets, Proper use of Colours and Shapes

Connecting to Data: Power Query, Pivot, Power Pivot within Excel

  • Power Query: Interface, Tabs

Connecting to data from other excel files, text files, other sources

  • Data Cleaning
  • Transforming
  • Loading Data into Excel Query
  • Using Loaded queries
  • Merge and Append
  • Insert Power Pivot
  • Similarities and Differences in Pivot and Power Pivot reporting
  • Getting data from databases, workbooks, webpages

VBA and Macros

  • View Tab
  • Add Developer Tab
  • Record Macro: Name, Storage
  • Record Macro to Format table (Absolute Ref)
  • Format table of any size (Relative ref)
  • Play macro by button, shape, as command (in new tab)
  • Editing Macros
  • VBA: Introduction to the basics of working with VBA for Excel: Subs, Ranges, Sheets
  • Comparing values and conditions
  • If statements and select cases
  • Repeat processes with For loops and Do While or Do Until Loops
  • Communicate with the end-user with message boxes and take user input with input boxes, User Form
  • Introduction to MySQL
  • Introduction to Databases
  • Introduction to RDBMS
  • Explain RDBMS through normalization
  • Different types of RDBMS
  • Software Installation (MySQL Workbench)
  • SQL Commands and Data Types
    • Types of SQL Commands (DDL, DML, DQL, DCL, TCL) and their applications
    • Data Types in SQL (Numeric, Char, Datetime)
  • DQL & Operators
    • SELECT
    • LIMIT
    • DISTINCT
    • WHERE AND
    • OR
    • IN
    • NOT IN
    • BETWEEN
    • EXIST
    • ISNULL
    • IS NOT NULL
    • Wild Cards
    • ORDER BY
    • Case When Then and Handling NULL Values
    • Usage of Case When then to solve logical problems and handling NULL Values (IFNULL, COALESCE)
  • Group Operations & Aggregate Functions
    • Group By
    • Having Clause
    • COUNT
    • SUM
    • AVG
    • MIN
    • MAX
    • COUNT String Functions
    • Date & Time Function
  • Constraints
    • NOT NULL
    • UNIQUE
    • CHECK
    • DEFAULT
    • Primary key
    • Foreign Key (Both at column level and table level)
  • Joins
    • Inner
    • Left
    • Right
    • Cross
    • Self Joins
    • Full outer join
  • DDL
    • Create
    • Drop
    • Alter
    • Rename
    • Truncate
    • Modify
    • Comment
  • DML & TCL Commands
    • DML
      • Insert
      • Update & Delete
    • TCL
      • Commit
      • Rollback
      • Savepoint
  • Data Partitioning
  • Indexes and Views
    • Indexes (Different Type of Indexes)
    • Views in SQL
  • Stored Procedures
    • Procedure with IN Parameter
    • Procedure with OUT parameter
    • Procedure with INOUT parameter
    • Function, Constructs
    • User Define Function
  • Window Functions
    • Rank
    • Dense Rank
    • Lead
    • Lag
    • Row_number
  • Union, Intersect, Sub-query
    • Union, Union all
    • Intersect
    • Sub Queries, Multiple Query
  • Exception Handling
    • Handling Exceptions in a query
    • CONTINUE Handler
    • EXIT handler
  • Triggers
    • Triggers - Before | After DML Statement
  • Introduction to Tableau
  • What is Tableau?
  • What is Data Visualization?
  • Tableau Products
  • Tableau Desktop Variations
  • Tableau File Extensions
  • Data Types, Dimensions, Measures, Aggregation concept
  • Tableau Desktop Installation
  • Data Source Overview
  • Live Vs Extract
  • Basic Charts & Formatting
  • Overview of worksheet sections
  • Shelves
  • Bar Chart, Stacked Bar Chart
  • Discrete & Continuous Line Charts
  • Symbol Map & Filled Map
  • Text Table, Highlight Table
  • Formatting: Remove grid lines, hiding the axes, conversion of numbers to thousands, millions, Shading, Row divider, Column divider
  • Marks Card
  • Filters
  • What are Filters?
  • Types of Filters
  • Extract, Data Source, Context, Dimension, Measure, Quick Filters
  • Order of operation of filters
  • Cascading
  • Apply to Worksheets
  • Calculations
  • Need for calculations
  • Types: Basic, LOD's, Table
  • Examples of Basic Calculations: Aggregate functions, Logical functions, String functions, Table calculation functions, numerical functions, Date functions
  • LOD's: Examples
  • Table Calculations: Examples
  • Data Combining Techniques
  • What is Data Combining Techniques?
  • Types
  • Joins, Relationships, Blending & Union
  • Custom Charts
  • Dual Axis
  • Combined Axis
  • Donut Chart
  • Lollipop Chart
  • KPI Cards (Simple)
  • KPI Cards (With Shape)
  • Groups, Bins, Hierarchies, Sets, Parameters
  • What are Groups? Purpose
  • What are Bins? Purpose
  • What are Hierarchies? Purpose
  • What are Sets? Purpose
  • What are Parameters? Purpose and examples
  • Analytics & Dashboard
  • Reference Lines
  • Trend Line
  • Overview of Dashboard: Tiled Vs Floating
  • All Objects overview, Layout overview
  • Dashboard creation with formatting
  • Dashboard Actions & Tableau Public
  • Actions: Filter, Highlight, URL, Sheet, Parameter, Set
  • How to save the workbook to Tableau Public website?
  • Power BI Introduction and Installation
  • Understanding Power BI Background
  • Installation of Power BI and check list for perfect installation
  • Formatting and Setting prerequisites
  • Understanding the difference between Power BI desktop & Power Query
  • The Power BI user interface, including types of data sources and visualizations
  • Getting familiar with the interface BI Query & Desktop
  • Understanding type of Visualization
  • Loading data from multiple sources
  • Data type and the type of default chart on drag drop
  • Geo location Map integration
  • Sample dashboard with Animation Visual
  • Financial sample data in Power BI
  • Preparing sample dashboard as get started
  • Map visual Types and usages in different variation
  • Understanding scatter Plot chart with Play axis and the parameters
  • Power BI artificial intelligence Visual
  • Understanding the use of AI in Power BI
  • AI analysis in Power BI using chart
  • Q&A chat bot and the use in real life
  • Hierarchy tree
  • Power BI Visualization
  • Understanding Column Chart
  • Understanding Line Chart
  • Implementation of Conditional formatting
  • Implementation of Formatting techniques
  • Power Query Editor
  • Loading data from folder
  • Understanding Power Query in detail
  • Promote header, Split to limiter, Add columns, append, merge queries etc
  • Modeling with Power BI
  • Loading multiple data from different format
  • Understanding modeling (How to create relationship)
  • Connection type, Data cardinality, Filter direction
  • Making dashboard using new loaded data
  • Power Query Editor Filter Data
  • Power Query Custom Column & Conditional Column
  • Manage Parameter
  • Introduction to Filter and types of filter
  • Trend analysis, Future forecast
  • Customize the data in Power BI
  • Understanding Tool tip with information
  • Use and understanding of Drill Down
  • Visual interaction and customization of visual interaction
  • Drill through function and usage
  • Button triggers
  • Bookmark and different use and implementation
  • Navigation buttons
  • DAX Expressions
  • Introduction to DAX
  • Table Dax, Calculated column, DAX measure and difference
  • Eg:- Calendar, Calendar auto, Summarize, Group by etc
  • Calculated Column
  • Related, Lookup value, switch, Datedif,Rankx,Date functions
  • DAX Measure and Quick Measure
  • Remove filters, Keep filters, All, Allselected, Time Intelligence Functions,Rolling average,YoY, Running total
  • Custom Visual
  • Custom visual and understanding the use of custom
  • Loading custom visual, Pinning visual
  • Loading to template for future use
  • Publishing Power BI
  • Power BI Service
  • Introduction to app.powerbi.com
  • Schedule refresh
  • Data flow and use Power BI from online
  • Download data as live in PowerPoint and more
  • Descriptive Statistics
  • Data Types, Measure Of central tendency, Measures of Dispersion
  • Graphical Techniques, Skewness & Kurtosis, Box Plot
  • Probability and Normal Distribution
  • Random Variable, Probability, Probility Distribution, Normal Distribution, SND, Expected Value
  • Inferential Statistics
  • Sampling Funnel, Sampling Variation, Central Limit Theorem, Confidence interval
  • Introduction to Hypothesis Testing
  • Hypothesis Testing (2 proportion test, 2 t sample t test)
  • Anova and Chisquare
  • Data cleaning and Insights
  • Data Cleaning(Invalid cells, Blanks, Outliers, Null values)
  • Imputation Techniques(Mean and Median)
  • Scatter Diagram
  • Correlation Analysis
  • Introduction to R
  • Installation of Rstudio
  • Data Types in R
  • Data types (Numeric, Char, Logical, Complex, Vector, List, Matrix, Factor, Array, Dataframe)
  • Relational operators
  • Logical operators
  • Decision making statements
  • Loops
  • Functions
  • If, Ifelse, For loop, While loop, Repeat, Functions
  • Built-in Functions in R
  • Joins
  • dplyr and ggplot2
  • Merging dataframes
  • Analyzing Iris Dataset using apply functions
  • dplyr package (Filter, Select, Arrange)
  • Data visualization using ggplot2
  • Scatterplot
  • Histogram
  • Boxplot
  • Introduction to ChatGPT and AI
  • What is ChatGPT?
  • The history of ChatGPT
  • Applications of ChatGPT
  • ChatGPT vs other chatbot platforms
  • Industries using ChatGPT
  • The benefits and limitations of ChatGPT
  • Future developments in ChatGPT technology
  • Ethical considerations related to ChatGPT and AI
  • Types of AI and ChatGPT architecture
  • What is AI?
  • Types of AI
  • What is Machine Learning?
  • Neural Networks
  • Deep Learning
  • Natural Language Processing (NLP)
  • Computer Vision
  • Robotics and AI
  • ChatGPT Functionalities and Applications
  • How does ChatGPT work?
  • ChatGPT Functionalities
  • Drafting emails and professional communication
  • Automating content creation
  • Resume and Cover letter creation
  • Research and information gathering
  • Brainstorming ideas and creative problem solving
  • Best Practices for Using ChatGPT
  • ChatGPT Prompt Engineering
  • What is Prompt Engineering?
  • Types of Prompts
  • Crafting Effective Prompts
  • Using ChatGPT to generate prompt

Batch Schedule for Data Analytics Pay After Placement Classes

S. No. Course Name Batch Schedule Duration
1 Evening Batch 25th May, 2024 5 Months
2 Morning Batch 23th May, 2024 6 Months
3 Afternoon Batch 29th May, 2024 6 Months
4 Online Batch (Morning) 20th May, 2024 4 Months
5 Online Batch (Evening) 26th May, 2024 4 Months


Data Analytics Pay After Placement training Students Reviews


Enrolling in the full stack web development course under the pay after placement scheme in Pune was one of the best decisions I've made for my career. The comprehensive curriculum coupled with hands-on projects provided me with a solid foundation in web development. The instructors were extremely knowledgeable and supportive throughout the whole program.

google reviews  

Raghav Sakariya


My experience with the data analytics course offered on a pay after placement basis in Pune was truly transformative. From learning fundamental concepts to mastering advanced techniques, every aspect of the course was meticulously designed to ensure maximum learning. The practical assignments and real-world case studies and real time knowledge.

google reviews  

Aman Pawar


Embarking on the journey of data science through the pay after placement course in Pune has been an enriching experience. The curriculum was extensive, covering everything from machine learning algorithms to big data analytics. The instructors were not only experts in their field but also excellent mentors who provided valuable guidance every step in way.

google reviews  

Mayank Patel


I cannot speak highly enough of the Data analytics course in pune offered on a pay after placement basis in Pune. The course content was comprehensive, and the hands-on approach enabled me to gain practical skills that are directly applicable in the workplace. The instructors were incredibly supportive, providing personalized attention and career guidance.

google reviews  

Ishaan Agarwal


My journey with the Data Analytics course in pune under the pay after placement program in Pune has been nothing short of exceptional. The course curriculum was well-structured, covering everything from basic data visualization techniques to advanced dashboard development. The hands-on projects and real-world case studies allowed me to apply my learning.

google reviews  

Ronit Hartalkar


Enrolling in Pune's pay after placement data Analytics course in pune was a turning point in my career. The course curriculum was rigorous and up-to-date, covering a wide range of topics such as machine learning, data visualization, and statistical analysis. The faculty members were highly experienced professionals who provided valuable insights and guidance through out.

google reviews  

Dhwani Shinde


Choosing Pune's pay after placement Data Analytics Pay After Placement Classes was a game-changer for my career trajectory. The immersive learning experience equipped me with the latest technologies and frameworks used in web development. The supportive faculty provided personalized guidance, ensuring that I mastered each concept thoroughly.

google reviews  

Amita Goyal


I am immensely grateful for the opportunity to enroll in Pune's pay after placement data analytics course in pune. The comprehensive curriculum covered all aspects of data analysis, from data preprocessing to predictive modeling. The practical assignments and industry-relevant projects helped me develop a strong foundation in data analytics.

google reviews  

Meera Watharkar


Enrolling in the Data analytics course in pune under the pay after placement scheme in Pune was one of the best decisions I've made for my career. The comprehensive curriculum coupled with hands-on projects provided me with a solid foundation in web development. The instructors were extremely knowledgeable.

google reviews  

Simran Pawar


The Data Analytics Pay After Placement training offered on a pay after placement basis in Pune exceeded all my expectations. The course content was comprehensive, covering everything from data modeling to report authoring. The hands-on projects and practical exercises helped me gain a deeper understanding.

google reviews  

Riya Sharma


My experience with the Data Analytics course in pune was nothing short of phenomenal. The course curriculum was well-structured, covering both basic and advanced concepts of data visualization. The hands-on approach allowed me to gain practical experience in creating interactive dashboards and visualizations.

google reviews  

Raghav Dhotre


Enrolling in Pune's Data Analytics Pay After Placement Classes with placements was a life-changing decision for me. The course curriculum was comprehensive, covering everything from front-end technologies to back-end frameworks. The hands-on projects and real-world case studies helped me apply theoretical concepts.

google reviews  

Rahul Pawar

Contact Us


Frequently Asked Questions

The duration of our data analytics course typically ranges from 3 to 6 months, depending on the specific program and the depth of coverage. We offer flexible scheduling options to accommodate students' needs.

There are no specific prerequisites for enrolling in our data analytics course. However, a basic understanding of mathematics, statistics, and programming concepts can be beneficial. Our course is designed to cater to students from diverse academic backgrounds.

Our data analytics course covers a comprehensive curriculum that includes topics such as statistics, data manipulation, data visualization, machine learning, and big data technologies. The curriculum is designed to provide students with a strong foundation in data analytics and prepare them for careers in the field.

Yes, Guidance Point is committed to providing placement assistance and career support services to our data analytics course graduates. Our dedicated placement cell works closely with leading organizations to help students secure job placements. We also offer resume building, interview preparation, and networking opportunities to enhance students' career prospects.

We offer flexible class timings and schedules for our data analytics course to accommodate students' needs. We have both weekday and weekend batches available, allowing students to choose a schedule that works best for them.

Our data analytics course is taught by experienced faculty members who are experts in the field of data analytics. They bring a wealth of industry experience and academic knowledge to the classroom, ensuring high-quality instruction and personalized attention for students.

Yes, our data analytics course includes industry projects, case studies, and practical assignments that allow students to apply their knowledge and skills to real-world scenarios. These hands-on learning opportunities are an integral part of our curriculum and help students gain practical experience.

Our data analytics course primarily follows an instructor-led format, with interactive sessions conducted by our experienced faculty members. However, we also offer some self-paced learning options to accommodate students' diverse learning styles and schedules.

Upon successfully completing our data analytics course, students will receive a certification from Guidance Point, acknowledging their proficiency in data analytics concepts and techniques. Our certification is recognized by industry professionals and can enhance students' career prospects.

To apply for our data analytics course, interested candidates can visit our website or contact our admissions team for more information. The admission process typically involves filling out an application form, attending an interview or assessment, and submitting any required documentation. Our admissions team will guide you through the process and assist you at every step of the way.


Data Analytics Pay After Placement Classes

Download SYLLABUS


JOB ORIENTED COURSES
  • 12+ FULL STACK COURSES
  • 12+ DATA SCIENCE COURSES
  • 10+ SAP TRAINING COURSES
  • 18+ COMPETITIVE TRAINING


Courses At Guidance Point
  • FULL STACK DEVELOPER COURSE
  • DATA SCIENCE TRAINING COURSE
  • 10+ SAP TRAINING COURSES

Guidance Point provide wide range of course in multiple domains with 44+ training courses with some of them with job assistance.